A body moves with uniform rectilinear motion (u.r.m.) when it has constant velocity, i.e., when its trajectory is a straight line and its speed is constant. In this section, we are going to study the constant velocity motion graphs, also know as u.r.m. graphs, that is:
U.R.M. Graphs
Position-time (x-t) graph
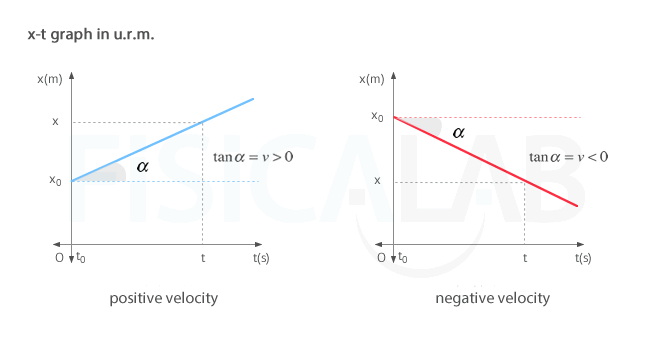
The graph position-time (x-t) of a uniform rectilinear motion (u.r.m.). represents time on the horizontal axis (t-axis) and position on the vertical axis (x- axis). Observe as the position (normally the x-coordinate) increases (or decreases) uniformly with time. We can distinguish two cases, when the velocity is positive or when it is negative:

We can get the velocity from the angle α. To do it just remember that in a right triangle the tangent of each of its angles is defined as the opposite side (cathetus) divided by the adjacent one:
The value of the slope is the magnitude of the velocity. Therefore, the greater the slope of the straight line, the higher the velocity of the body.
Velocity-time (v-t) graph
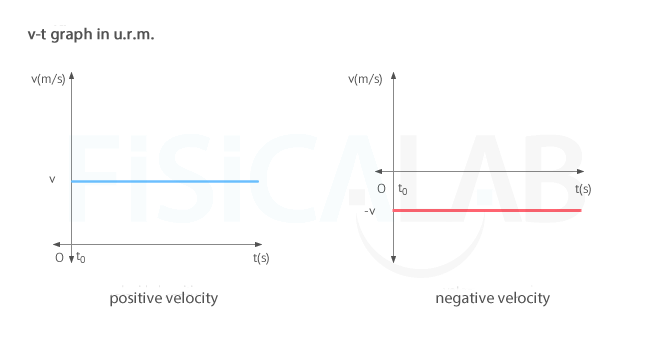
The graph velocity-time (v-t) of a uniform rectilinear motion (u.r.m.) shows that the velocity remains constant over time. Again, we can distinguish two cases:

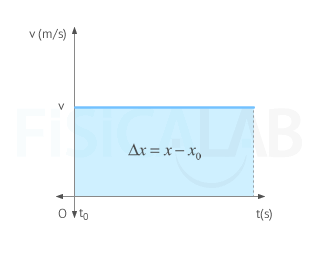
Notice that the area enclosed under the curve between two instants of time is the distance traveled.

Distance traveled graph
The area enclosed inside the straight line v-t, the abscissa axis and the times t and t0 corresponds to the distance traveled. This property is valid for any kind of motion.
In particular for the u.r.m., since it is the area is of a rectangle (base x height):
In this case, it is just the calculation of said area, since it is a rectangle. But, do you know what mathematical tool enables the calculation of the area under a curve, whatever its form?
Acceleration-time (a-t) graph
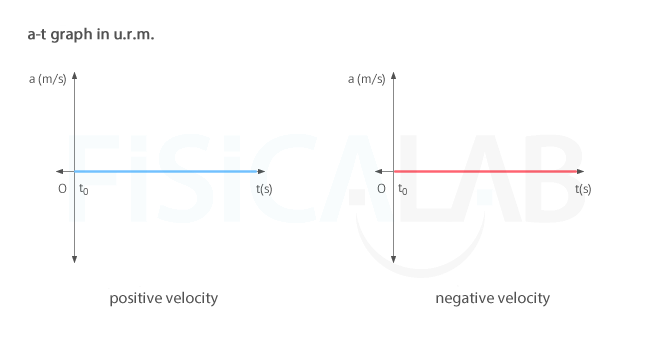
The graph acceleration-time (a-t) of a uniform rectilinear motion (u.r.m.) shows that the acceleration is always zero. In this case, whether the velocity of the body is positive or negative, there is only one possibility, illustrated in the figure:


